
Clean Energy Tracker
How much renewable power is TEP delivering to customers right now? This display tracks the output of 20 solar arrays and four wind farms that make up our cost-effective, community-scale renewable energy portfolio. Scroll down to see how their total output compares to customers' energy usage and to track individual system production.
Output and Usage


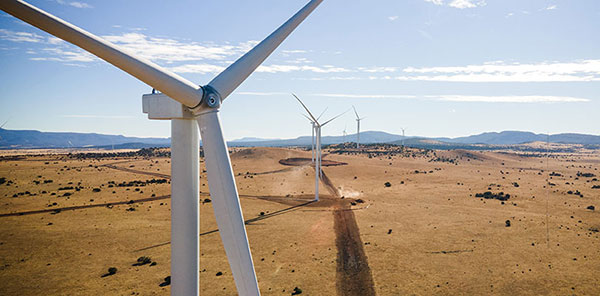
Current Wind Output
- 62 Wind Turbines
- Up to 600-foot tall towers
- Owned and operated by TEP
- Completed in 2021
- 34 Wind Turbines
- Up to 670-foot tall towers
- Power purchase agreement
- Completed in 2021

- 28 wind turbines
- 264-foot tall towers
- Power purchase agreement
- Completed in 2011

- 15 wind turbines
- 450-foot tall towers
- Power purchase agreement
- Completed in 2015
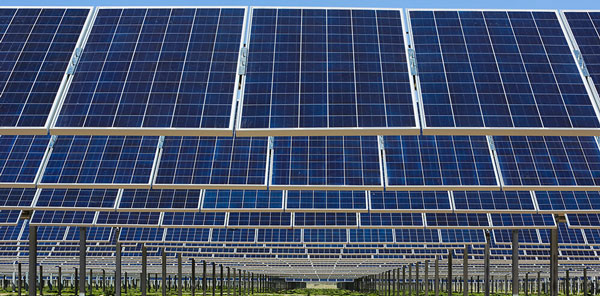
Current Solar Output
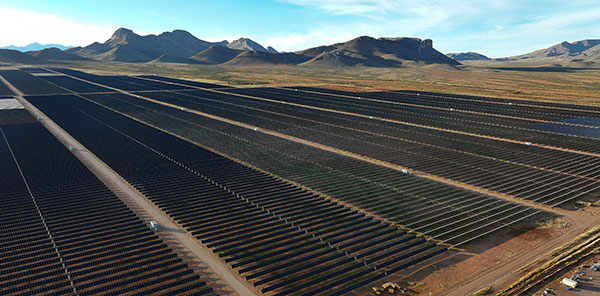
- Single-axis tracker
- 342,472 polycrystalline PV panels
- Power purchase agreement
- Completed in 2026
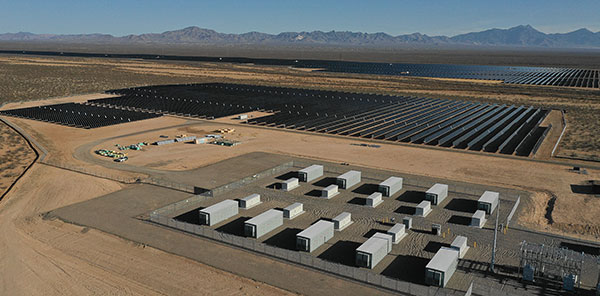
- Single-axis tracker + battery storage
- 224,755 photovoltaic panels
- Power purchase agreement
- Completed in 2026
- Single-axis tracker + battery storage
- 314,000 polycrystalline PV panels
- Power purchase agreement
- Completed in 2021
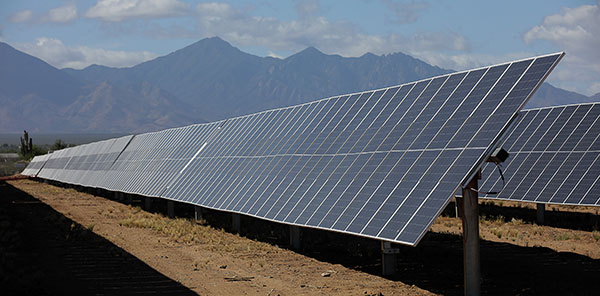
- Single-axis tracker
- 250,000 polycrystalline PV panels
- Power purchase agreement
- Completed in 2015
- Single-axis tracker
- 115,000 polycrystalline PV panels
- Power purchase agreement
- Completed in 2014
- Single-axis tracker
- 410,000 thin-film modules
- Power purchase agreement
- Completed in 2012
- Single-axis tracker
- 88,000 polycrystalline PV panels
- Power purchase agreement
- Completed in 2012
- Fixed-tilt
- 103,000 polycrystalline and thin-film panels
- Owned and operated by TEP
- Completed in 2014 and expanded in 2017
- Single-axis tracker
- 70,000 polycrystalline PV panels
- Power purchase agreement
- Completed in 2016
- Fixed tilt and single-axis trackers
- 54,904 modules
- Owned and operated by TEP
- Completed in 2000 and expanded in 2010 and 2014
- Single-axis trackers
- 35,000 double-sided PV panels
- Owned and operated by TEP
- Completed in 2022
- Single-axis tracker
- 47,000 polycrystalline PV panels
- Power purchase agreement
- Completed in 2013
- Single-axis tracker
- 24,000 polycrystalline PV panels
- Power purchase agreement
- Completed in 2012
- Fixed-tilt
- 21,000 polycrystalline PV panels
- Owned and operated by TEP
- Completed in 2011
- Fixed-tilt
- 48,000 thin-film modules
- Power purchase agreement
- Completed in 2012
- Fixed-tilt
- 21,000 polycrystalline PV panels
- Owned and operated by TEP
- Completed in 2011
- Fixed-tilt
- Polycrystalline PV panels
- Power purchase agreement
- Completed in 2017
- Single-axis tracker
- 6,000 monocrystalline PV panels
- Owned and operated by TEP
- Completed in 2010
- Single-axis tracker
- Polycrystalline PV panels
- Power purchase agreement
- Completed in 2014
- Double-axis tracker
- Photovoltaic lenses
- Power purchase agreement
- Completed in 2011
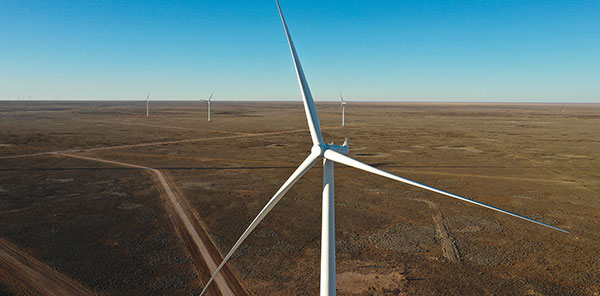
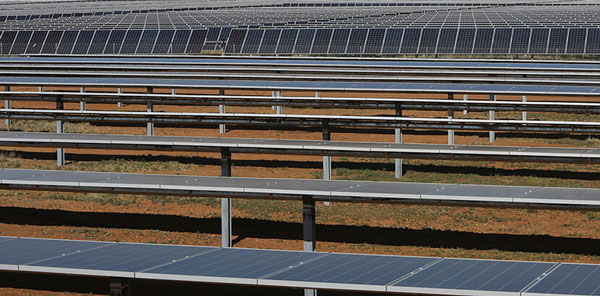
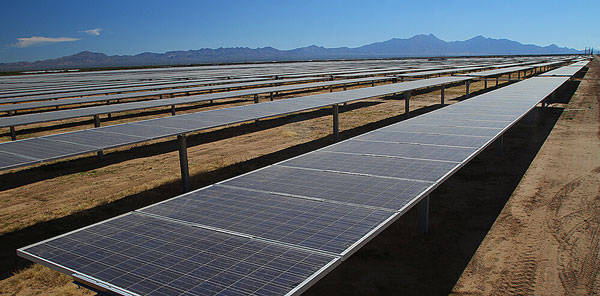
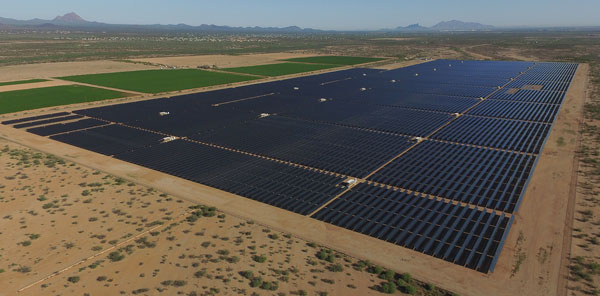
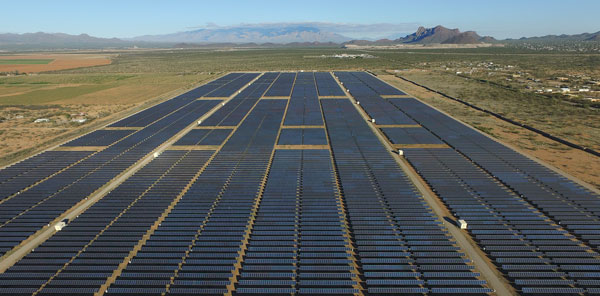
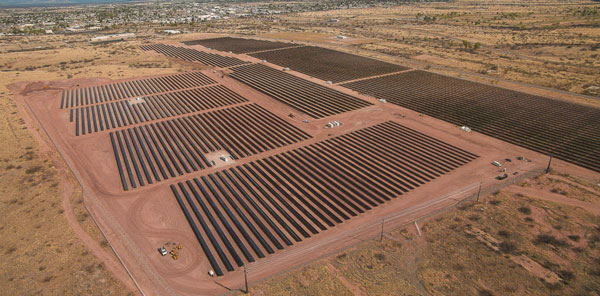
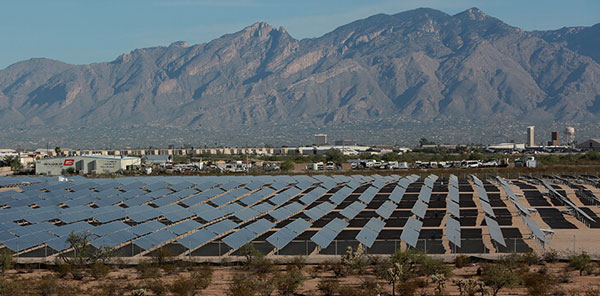
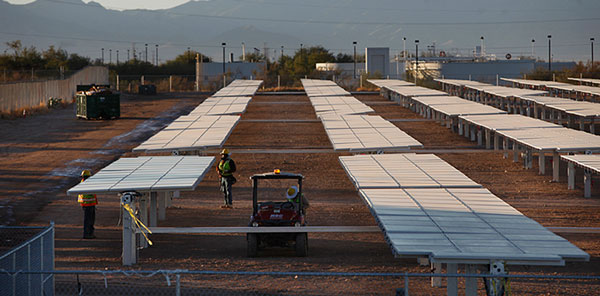
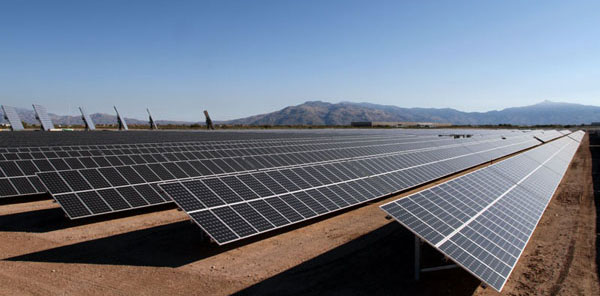
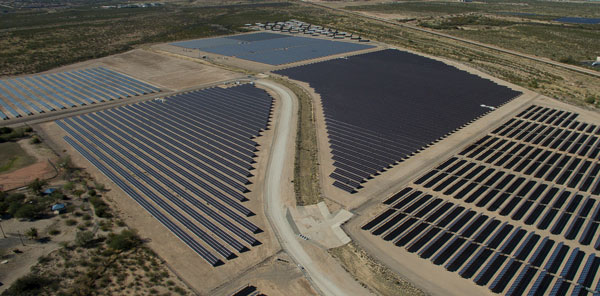
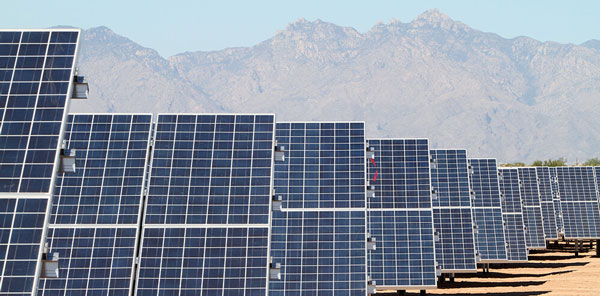
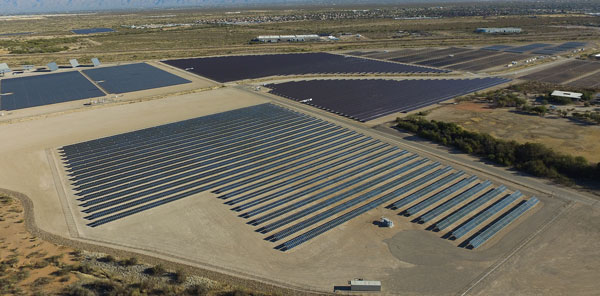
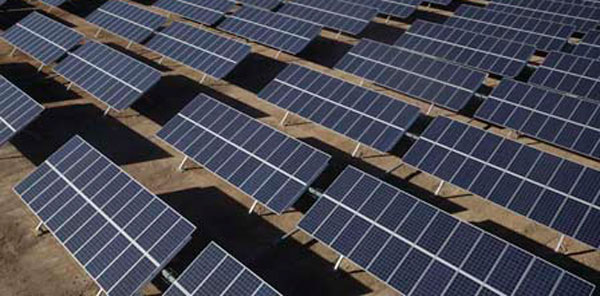
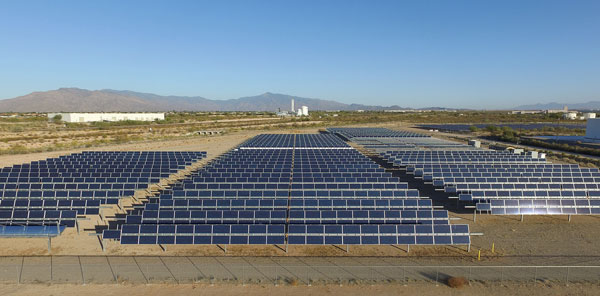
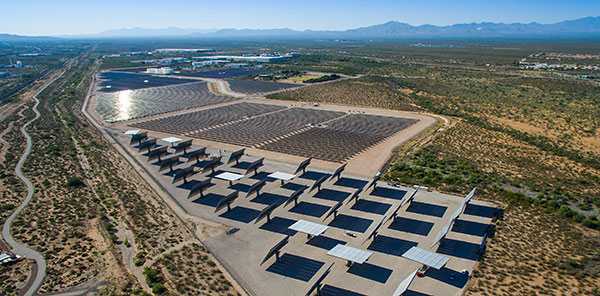
Our renewable resources
Tucson Electric Power has an expanding portfolio of solar arrays, wind farms and other clean renewable resources to help us provide safe, reliable and affordable electric service to our community.
We’re working to achieve net zero carbon emissions by 2050. This aspirational target was established as part of our latest Integrated Resource Plan to ensure that we’re doing our part to support global efforts to combat climate change.
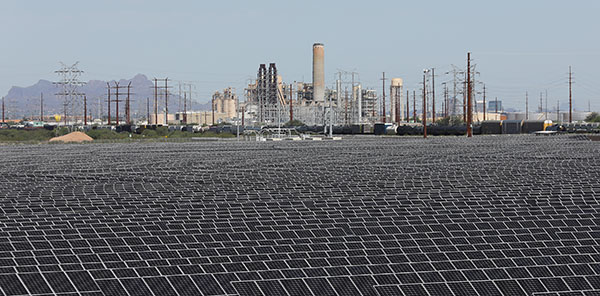
The dashboard above includes the output from our largest renewable energy resources. It does not include energy produced by private solar arrays. The output shown for the Wilmot Energy Center includes the combined real-time output of its solar panels and its energy storage system, minus any energy being used to charge the batteries.
Click here for a complete overview of our renewable resources.
This page includes details about all the energy we deliver to all our customers, including those who have contracted to purchase renewable energy for themselves. To ensure that the energy these customers buy isn't also being counted for others, we provide them with tracking reports that remove renewable energy dedicated to serve other customers.