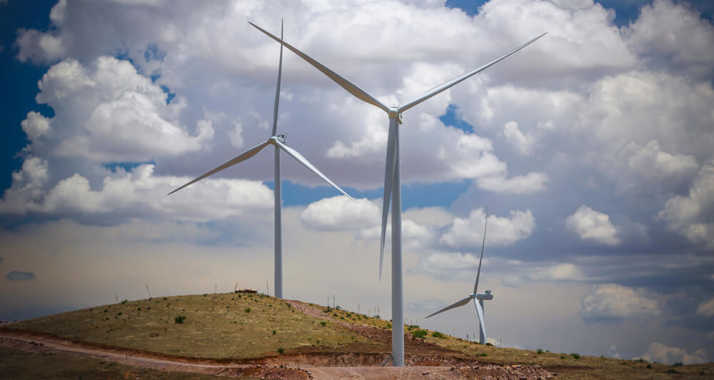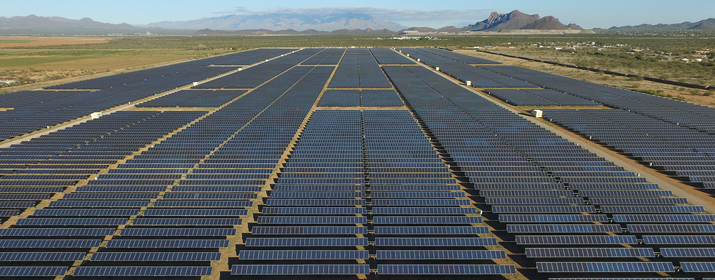
How much energy are Tucson Electric Power’s large solar and wind systems producing at any given time? Find out now on tep.com.
We’ve posted a dashboard that displays the current output of our community-scale renewable energy resources. Updated every three minutes, the gauges and graphs offer real-time evidence of TEP’s strong commitment to renewable energy.
“The dashboard provides a great visual representation of the impact our renewable resources have on the grid,” said Ted Burhans, Director of Renewable Energy.
The dashboard shows:
- The individual and total output from 17 large solar and wind energy systems – the majority of TEP’s renewable energy resources.
- The number of homes that could be powered by the current amount of wind and solar energy, based on historic usage data.
- The percentage of TEP’s total energy needs that are being satisfied by those large-scale renewable resources.
- Line graphs that compare today’s solar and wind generation to the previous day’s generation.
The dashboard tracks systems that are helping TEP work toward delivering 30 percent of our power from renewable sources by 2030 – double the state’s goal of 15 percent by 2025. About 12.6 percent of the energy we delivered last year came from renewables, well above Arizona’s 7 percent requirement for 2017.
The share of energy provided by renewables varies greatly throughout the day, depending on the time, cloud cover, wind conditions and other factors. TEP’s graphs show how solar generation peaks in the middle the day but falls off at night, often when the demand for energy is the highest.
The dashboard does not include the solar power systems at TEP’s Springerville Generating Station in eastern Arizona, smaller test systems or the solar boost system that supplements output at TEP’s Sundt Generating Station in Tucson. It also does not include excess energy from private rooftop solar arrays.


