How much clean energy is available on TEP’s local grid?
It depends. Unlike conventional power plants, wind and solar power systems only produce energy when its windy or sunny. Their output also varies with the weather and the time of day, as solar arrays produce less power when it’s cloudy or when the sun isn’t directly overhead.
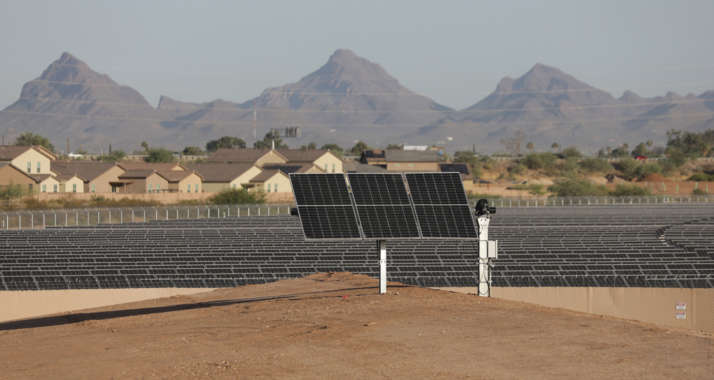
You can check current clean energy levels anytime using the TEP Clean Energy Tracker on tep.com. The tracker shows how real-time output from our 17 community-scale solar arrays and four wind farms compares to current energy use across our community.
Our clean energy systems can produce a combined 740 megawatts (MW) and provide more than 20 percent of the power our customers use over the course of a year. But that percentage varies widely throughout the year, from as low as zero on dark, still nights to as high as 100 percent during periods of high production and low energy use.
Renewable energy reduces our community’s impact on the environment, helping us respond to a changing climate and contributing to our plans for a cleaner energy portfolio that will produce 80 percent less carbon dioxide by 2035.
The following answers to common questions help explain how the Clean Energy Tracker works.
How does the tracker display the output of TEP’s renewable resources?
In addition to providing total MW production, the Clean Energy Tracker estimates the number of homes that could be served by that energy. This is calculated by dividing total production by the average residential electric usage for that same hour. The number of customers served by the same level of energy production varies by season and even time of day.
When are clean energy levels typically the highest, as a percentage of total usage?
Our tracker typically shows larger percentages and higher levels of homes served in the winter. Although we see comparable clean energy production in other seasons, energy usage rises in the spring, summer and fall due to increased reliance on air conditioning.
Sometimes, when temperatures are moderate and usage is very low, our wind and solar power systems can actually produce more energy than our customers are using! During these brief periods, any excess energy from our renewable and conventional generating systems flows to other users on the regional energy grid.
Conversely, that same level of production might represent less than 30 percent of peak energy demands in the summer. And our systems are generally producing at lower levels during those late afternoon hours because the sun is sinking toward the western horizon.
How do I find the hours of highest renewable energy production for TEP?
TEP’s Clean Energy Tracker includes a chart that shows both renewable energy production and total energy usage throughout the day. Below that chart, you’ll find “Renewable daily max,” which indicates the total amount of renewable energy TEP produced so far for the day. Tip for reading the chart: When the blue and green areas of the chart are closest together, the highest percentage of customers are being powered by clean energy!
How can I be assured I’m using the greatest amount of renewable energy to power my home?
The best way to do this is to shift your energy usage to times when renewable resources are most productive and avoiding energy usage during times of high demand in late afternoon and early evening. Typically, the highest production of solar energy occurs late morning through midafternoon when the sun is highest in the sky and energy usage by customers is at its lowest. Customers should try to shift energy usage to midday, early afternoon and at night, when wind power is generated. These are the best times to use appliances and electronics and run pool pumps and air conditioning.
Can TEP store solar energy for use later in the day?
We are expanding our use of energy storage systems to help us make better use of solar energy. For now, our largest such resource is a 30-MW battery system charged by a 100-MW solar array at the Wilmot Energy Center in southeast Tucson. On most days, the 314,000 solar panels charge the batteries in the morning and early afternoon when solar resources are most productive. The system then delivers stored energy during peak usage periods later in the afternoon and early evening.
Our long-range plans call for the addition of more than 1,000 MW of new energy storage systems by 2035. Such systems are critical to our plans for a cleaner energy future because they can “shift” solar energy generated at midday for use during peak usage periods. They also help compensate for the intermittent output of solar and wind power systems and can support reliability during cloudy weather.
Does the Clean Energy Tracker include energy produced by rooftop solar arrays?
No. Our tool can only track energy produced by the large-scale systems owned and operated by TEP or built by others to sell us energy. For this reason, the percentage of clean energy on our grid could be higher than shown on our tracker due to excess energy from rooftop solar arrays – particularly at midday on sunny days. As of September 2023, more than 46,800 TEP customers have installed private solar arrays that can produce a total of 574 MW.


